
Testing the limits of bundling capacity (1)
What happens as we pack more and more facts into a bundle? We study the limits of bundling capacity with a 50-item questionnaire.

On this page
In our earlier research experiments, we showed what we can recover from a bundled hypervector that encoded five facts per record. Working with that simple dataset left us with a follow-up question: are bundled representations still useful as we add many more facts?
Data records from the real world often contain far more than five facts. A completed questionnaire, for example, can hold dozens of answers and numeric fields that we’d like to keep together, as they represent the respondent’s overall personality profile.
In this post, we use the IPIP 50-item Big-Five questionnaire, which asks people to rate statements about their social habits, organization, emotional responses, and other aspects of personality. Researchers have used it to study relationships between personality and self-reported health.1 It makes sense for this study because it has a fixed number of questions, and each question has a numeric answer that can be encoded as a hypervector. We can then pack all 50 question-answer pairs into one bundled hypervector, and then test what we can recover from it.
During retrieval, we may want to inspect a bundle for only one of its facts, or find similar response patterns in other profiles. We ask the fundamental question: as more and more facts are packed into a bundle, can we still recover useful information?
The questionnaire dataset
For our experiments, we constructed 31 synthetic patient response profiles, each with a response score from 1 to 5 for every one of the 50 questions.
A bound question-answer pair is one fact hypervector that our encoder uses. An answer rating of “4” for a question about social habits tells us something different from a “4” for a question about organization. We give each question an independent random bipolar role hypervector, whose components are . Every profile reuses the same “question” roles.
The answer scores use the “level” encoding strategy in TorchHD,2 allowing us to encode nearby numerical values as hypervectors that resemble each other more than distant ones. A “4” is therefore closer to a “3” than to a “1”. This preserves the relative positions of the response scale so that we can query them more appropriately.
Some questions describe the same trait in opposite directions. A high rating for Q19, “seldom feel blue”, points towards greater emotional stability, while a high rating for Q49, “often feel blue”, points towards less. From our encoder’s perspective, Q49 is negatively scored, so we follow the published IPIP scoring directions and flip the ratings for negatively scored questions before encoding.
On our 1-to-5 scale, we encode for questions like Q49 instead of the raw rating : 1 becomes 5, 5 becomes 1, and 3 stays 3. The two responses below therefore receive the same score, meaning that they point in the same direction for the trait being measured:
| Question | Raw response | Scored response |
|---|---|---|
| Q19: “Seldom feel blue” | 5 | 5 |
| Q49: “Often feel blue” | 1 | 5 |
During encoding, both these different question-answer pairs are encoded with unique, atomic “question” role hypervectors, so we still keep them as separate facts. During retrieval, we retain the raw responses and undo the reversal before reporting the answer to the user.
We bind each question’s role hypervector to its scored answer hypervector, then bundle the resulting facts:
Here, is the number of question-answer pairs included in the bundle, which goes all the way up to 50. In MAP, binding multiplies components element-wise, while bundling adds the resulting fact hypervectors element-wise. We store the raw component sums in the bundle within the storage layer (without any normalization). Adding more facts changes the sums while leaving the number of dimensions fixed.
Experiments
The effect of adding more facts to a bundle is studied in a progressive series of runs. We built nested bundles containing the first 5, 10, 20, 30, 40, and 50 questions. We also swept these runs using hypervectors with increasing dimensionality, at 512, 2,048, 4,096, and 8,192 dimensions, and we repeated the experiments with five random seeds.
E1: Recover individual answers
The encoder combined a respondent’s answers into one “answer hypervector”. Now our goal is to recover the answer to Q19: “Seldom feel blue.”
To recover the answer, we multiply the bundle by Q19’s question (role) hypervector.
Applying the same bipolar role twice cancels its effect on the Q19 contribution, leaving the answer hypervector we put in. The other facts are still present, transformed by that role, so the result is the answer plus interference from the rest of the bundle.
This interference is called crosstalk. We described the reason why it exists in our previous post. We recover the rating by choosing the closest of the five stored answer hypervectors, a lookup called cleanup. If the original answer was 4, interference from the other facts might make the noisy result more similar to the stored hypervector for 3. Cleanup would then return 3 instead of 4.
Encoding more question-answer pairs into a bundle creates more opportunities for crosstalk. To see how much precision we lose, this experiment measures both exact recovery and average rating error. If the true answer is 4 and we recover 3, the rating error is one point; recovering 1 gives an error of three points. Exact recovery counts both as wrong, while rating error tells us how far off they are. These are mistakes in reading the bundle, with no errors added to the original responses.
The chart follows both measurements as facts accumulate. Lines show the mean across five seeds, with shading showing their range. The accuracy axis starts at 75% to make differences near the top visible.
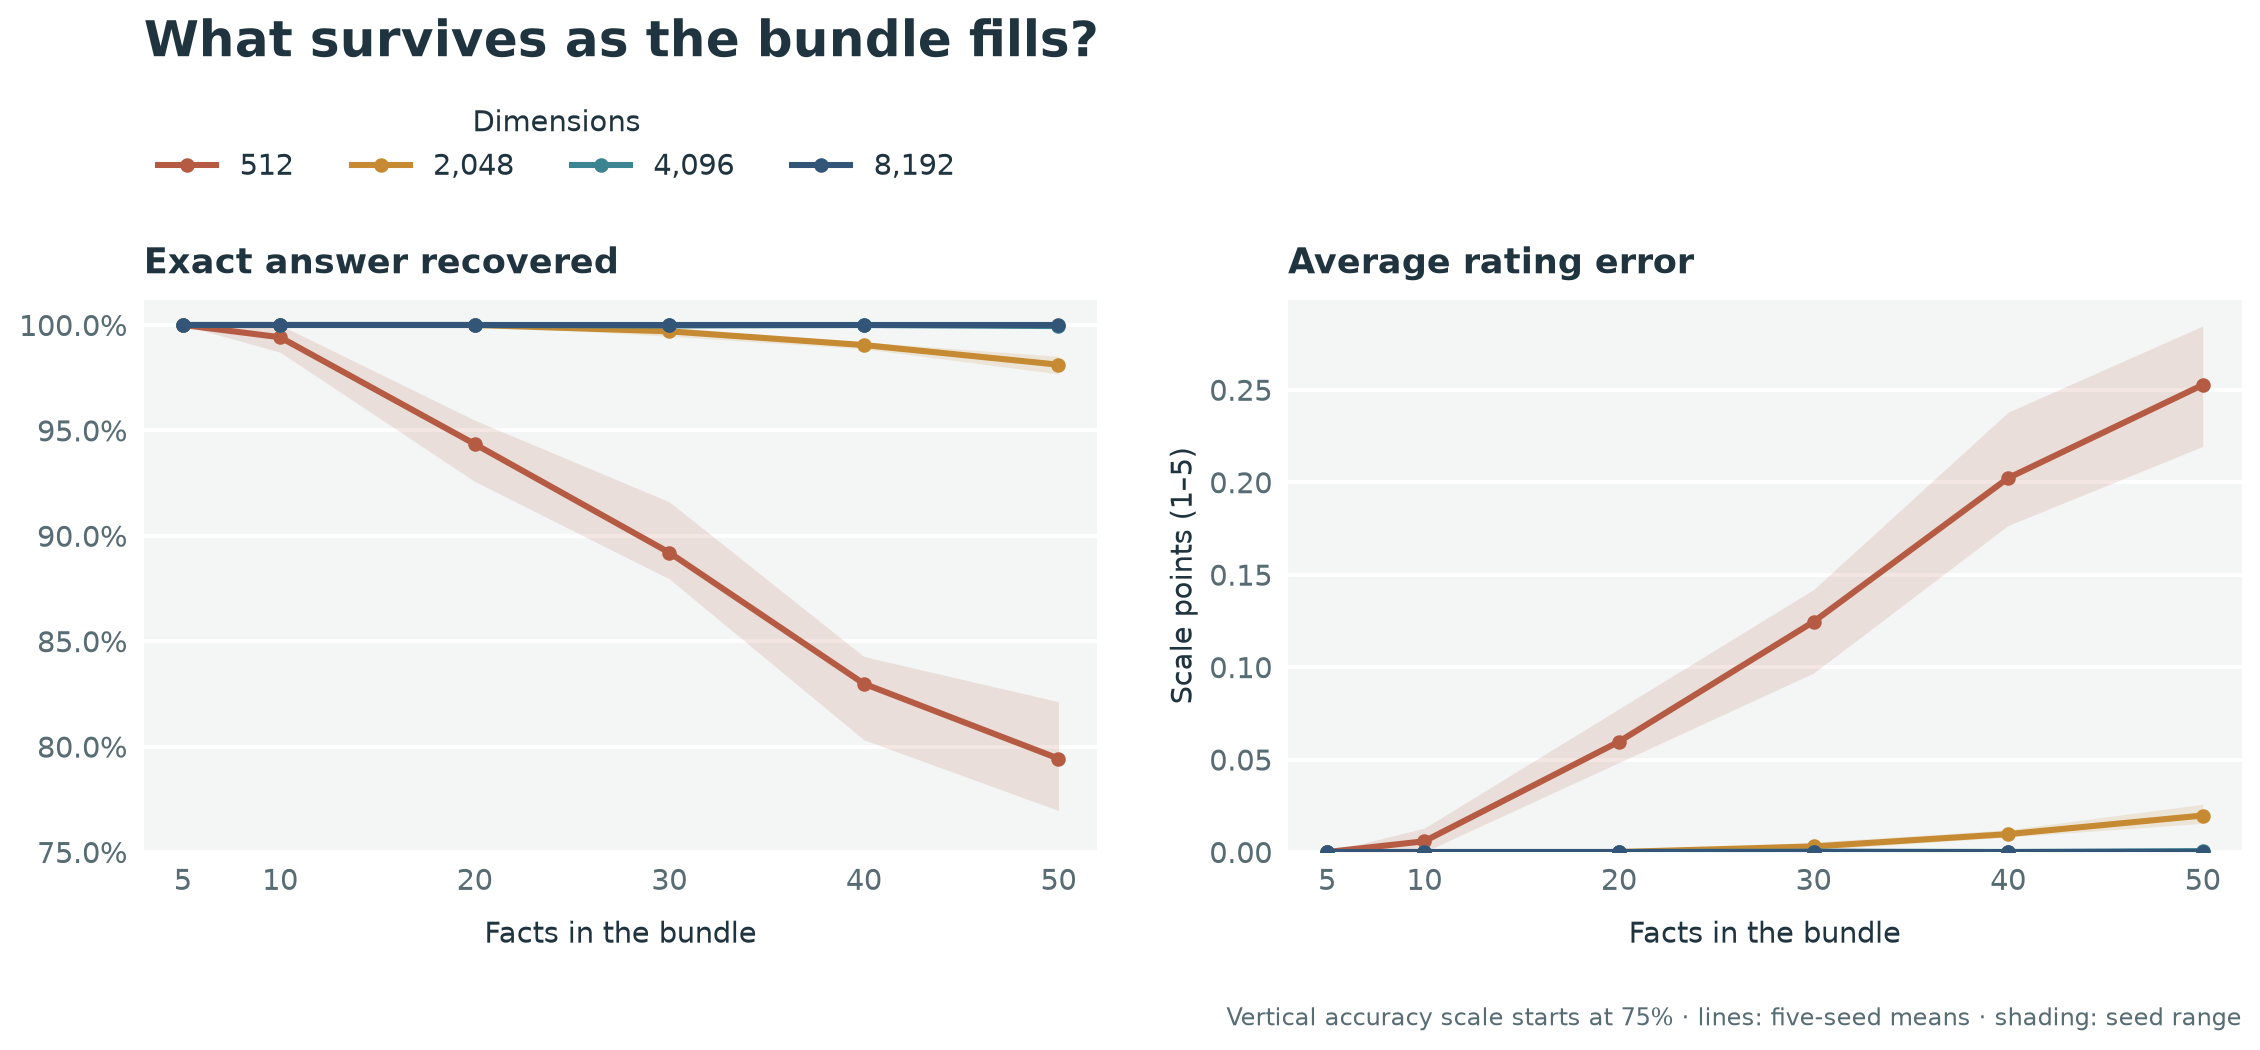
With only 5 question-answer pairs, the 512-dimensional hypervector bundles recover every answer correctly. We don’t need as many dimensions when the bundle is small. With 50 question-answer pairs crammed into a 512-dimensional space, exact recovery falls to 79.4%, but 96.1% of answers are either correct or just one point away. Much of the loss is therefore a loss of precision: the bundle often retains the rough rating even when it can’t distinguish the exact level.
Increasing the number of dimensions in our hypervector space protects that distinction. For 50 question-answer pairs and 2,048 dimensions, we get an exact recovery of 98.1%. At 4,096 dimensions, only four of 7,750 recovered answers are wrong, all by one point. At 8,192 dimensions, all 7,750 recovered answers are correct. These recovery attempts cover 31 profiles and 50 questions across five random seeds.
E2: Find similar respondent profiles
Suppose we’re building an HDC app to find respondents with similar questionnaire answers. Each respondent’s answers are encoded in one bundled hypervector. A researcher selects a respondent, and the app compares their hypervector with the others to suggest people with similar responses.
This experiment is designed to check whether comparing bundles gives us the same relationships between respondents as comparing their answers directly, even as more facts enter each bundle. We compare the bundled hypervectors directly using cosine similarity.
We need a reference for what “similar answers” means. First, we compare the original response lists by their average rating difference at matching questions. Second, we calculate the similarity implied by the five answer hypervectors before bundling. The second reference helps us distinguish how we chose to represent the response scale from what changed when we combined the facts.
We then check two kinds of agreement:
- Pair ranking: Do the bundles order profile pairs from more to less similar in much the same way as the reference? We measure this with Spearman rank correlation, where 1 means identical ordering.
- Three-neighbour overlap: For each profile, how many of the three closest profiles in the reference also appear among its three closest bundle matches?
The chart shows pair ranking on the left and three-neighbour overlap on the right. The top row uses differences in the original responses; the bottom row uses the ideal answer-level similarity. Lines again show five-seed means, with shading showing the seed range.
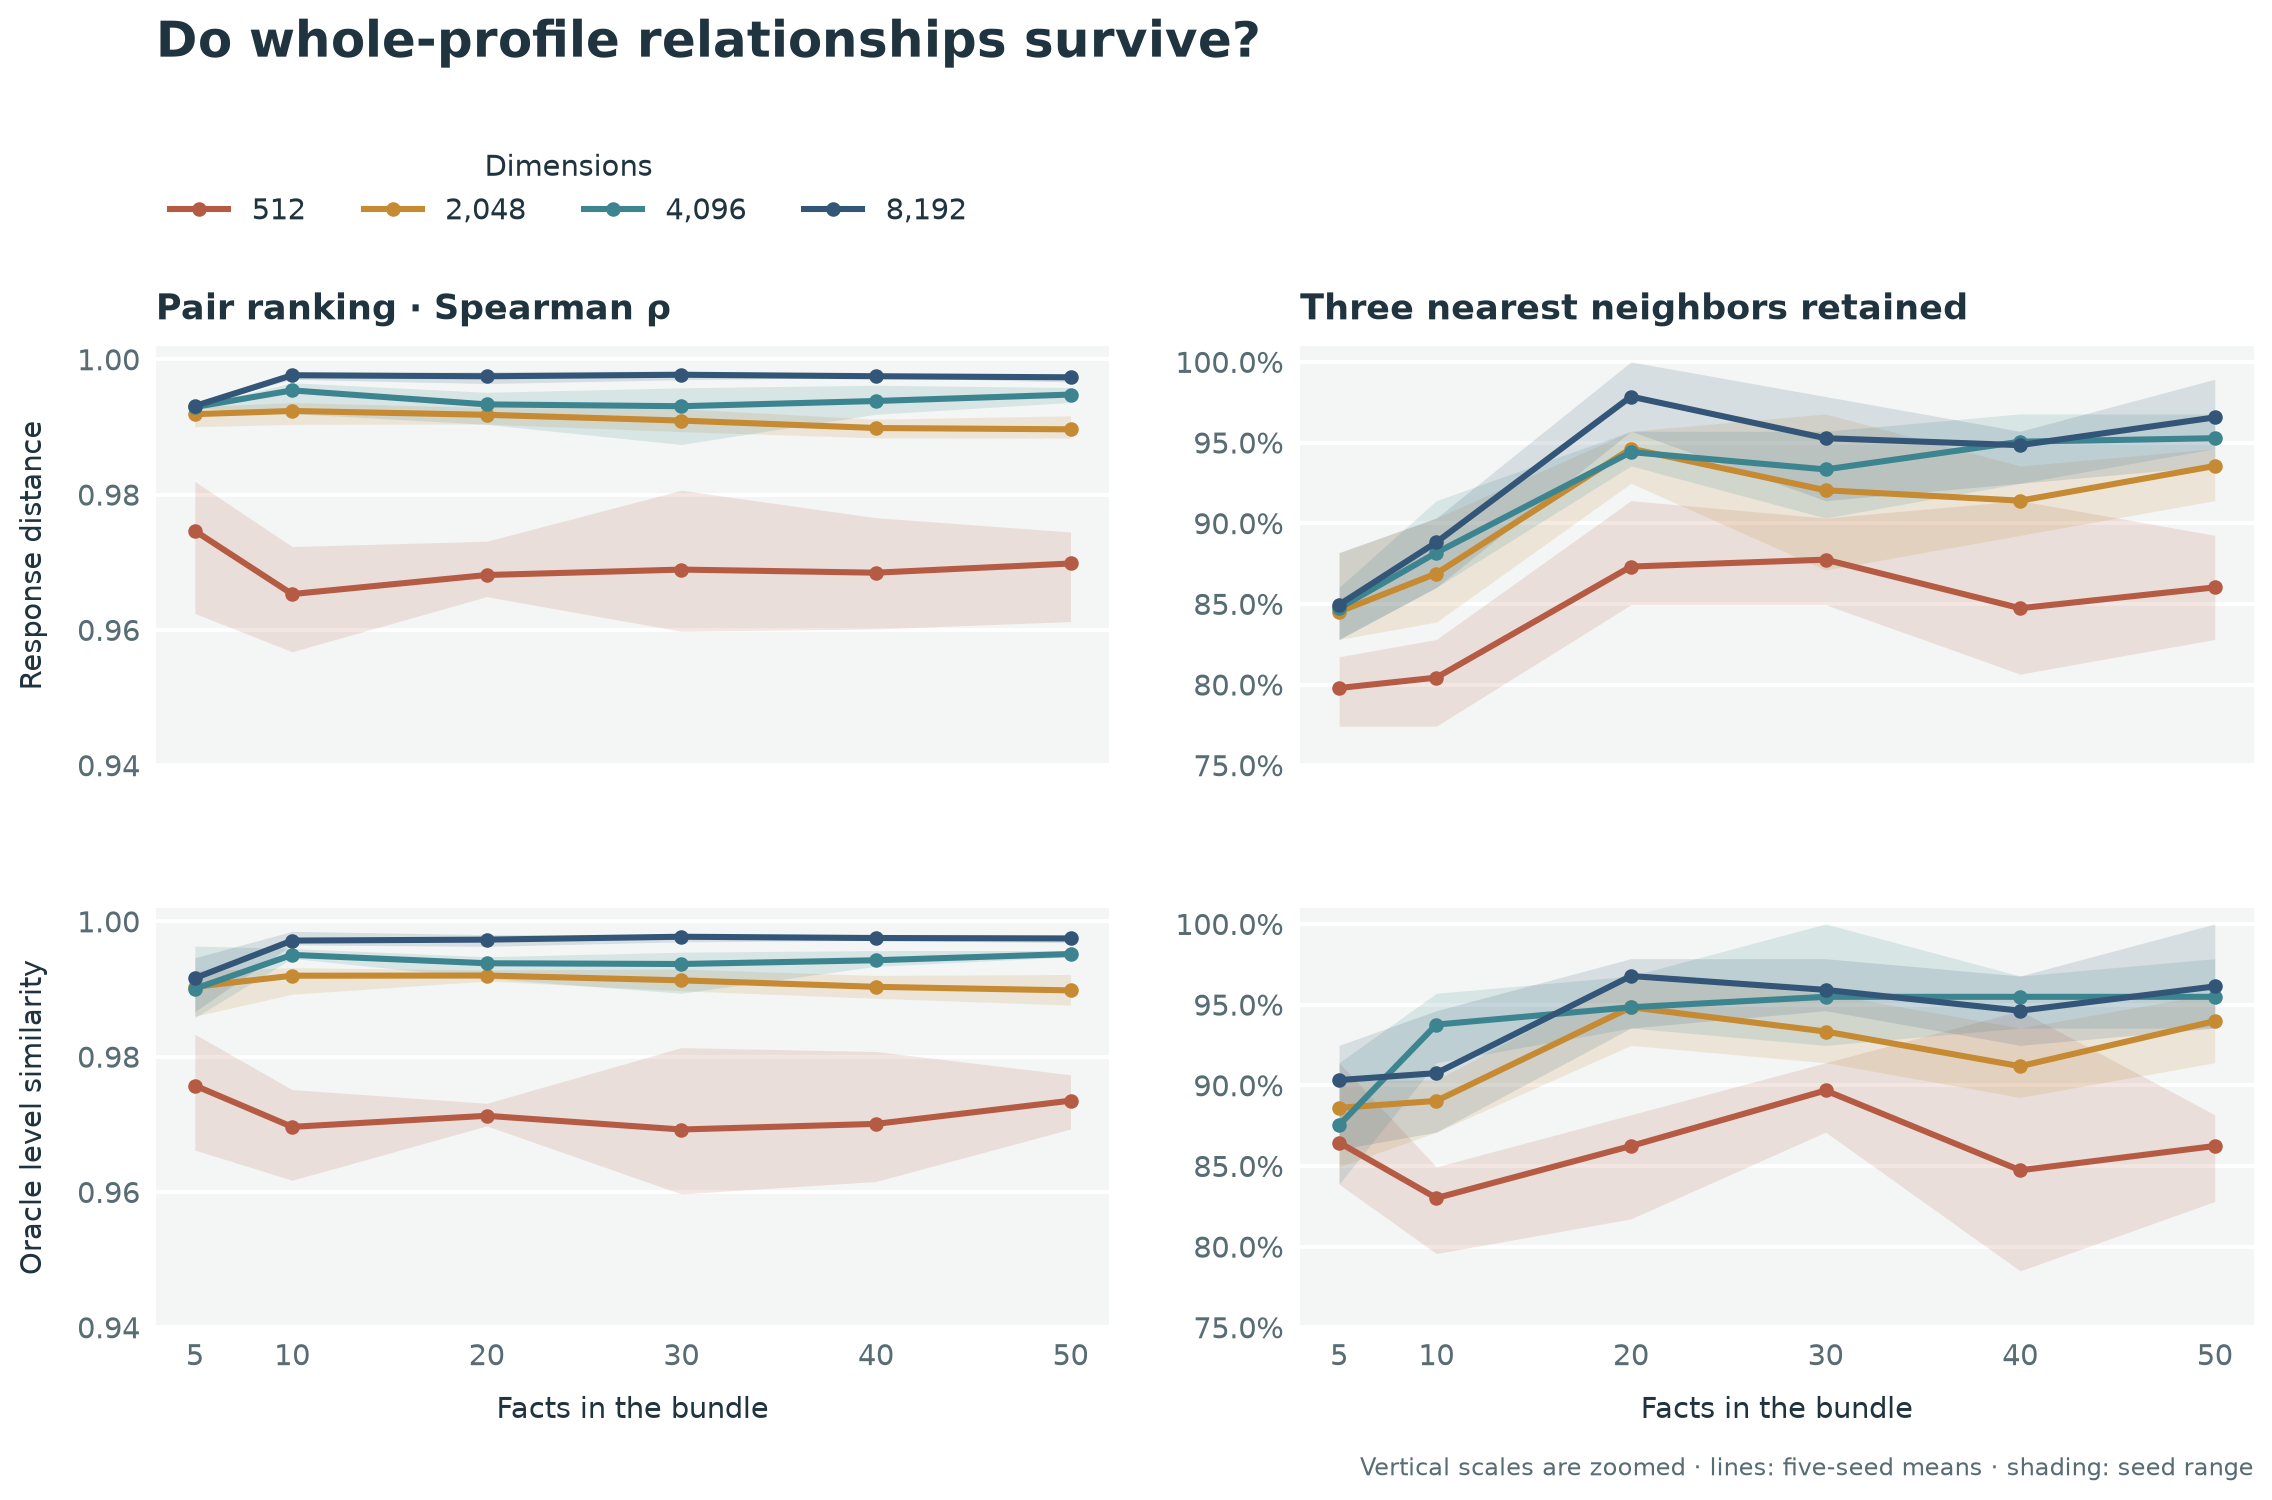
At 512 dimensions and 50 facts, pair-ranking correlation with the original answer lists is 0.970, and three-neighbour overlap is 86%. The same bundles that miss some individual answers still preserve much of the relationship between complete response patterns. More dimensions improve the candidate lists: at 2,048 dimensions, the overlap reaches 93.5%. At 8,192 dimensions, the overlap is 96.6%.
The finding here is that at lower dimensions, the bundles may capture which questionnaires are broadly similar, but can miss some of the closest matches. At 2,048 dimensions and above, they find more of the same closest matches as a direct comparison of the original answers, giving us a more reliable shortlist.
The right-hand plots show that at 512 dimensions, we miss more of the three closest respondents, and adding questions doesn’t steadily fix that. At 2,048 dimensions and above, we find more of the expected matches. Those higher lines cluster together, showing smaller gains from further increases in dimension.
E3: Measure similarity after changing answers
In this experiment, we ask whether profile similarity fades as bundles grow. We want to know whether adding up to 50 questionnaire answers makes a profile’s bundled hypervector less similar to a changed copy, even when the proportion of answers that differ stays the same.
We make two copies of each synthetic profile, changing 20% or 60% of its raw answers by one scale point. Here’s an example with five questions:
| Profile | Q1 | Q2 | Q3 | Q4 | Q5 |
|---|---|---|---|---|---|
| Original | 2 | 4 | 3 | 1 | 5 |
| Copy with 20% changed | 2 | 4 | 4 | 1 | 5 |
| Copy with 60% changed | 3 | 3 | 3 | 2 | 5 |
Bold entries mark the changes. At 4,096 dimensions, we measure cosine similarity between the bundled hypervectors of the original and each copy as we increase from 5 to 50 answers. With 50 answers, the copies have 10 or 30 changes.
The chart also shows the similarity predicted by the answer hypervectors before bundling. Results combine five seeds; shading covers the middle 90% of pair measurements.
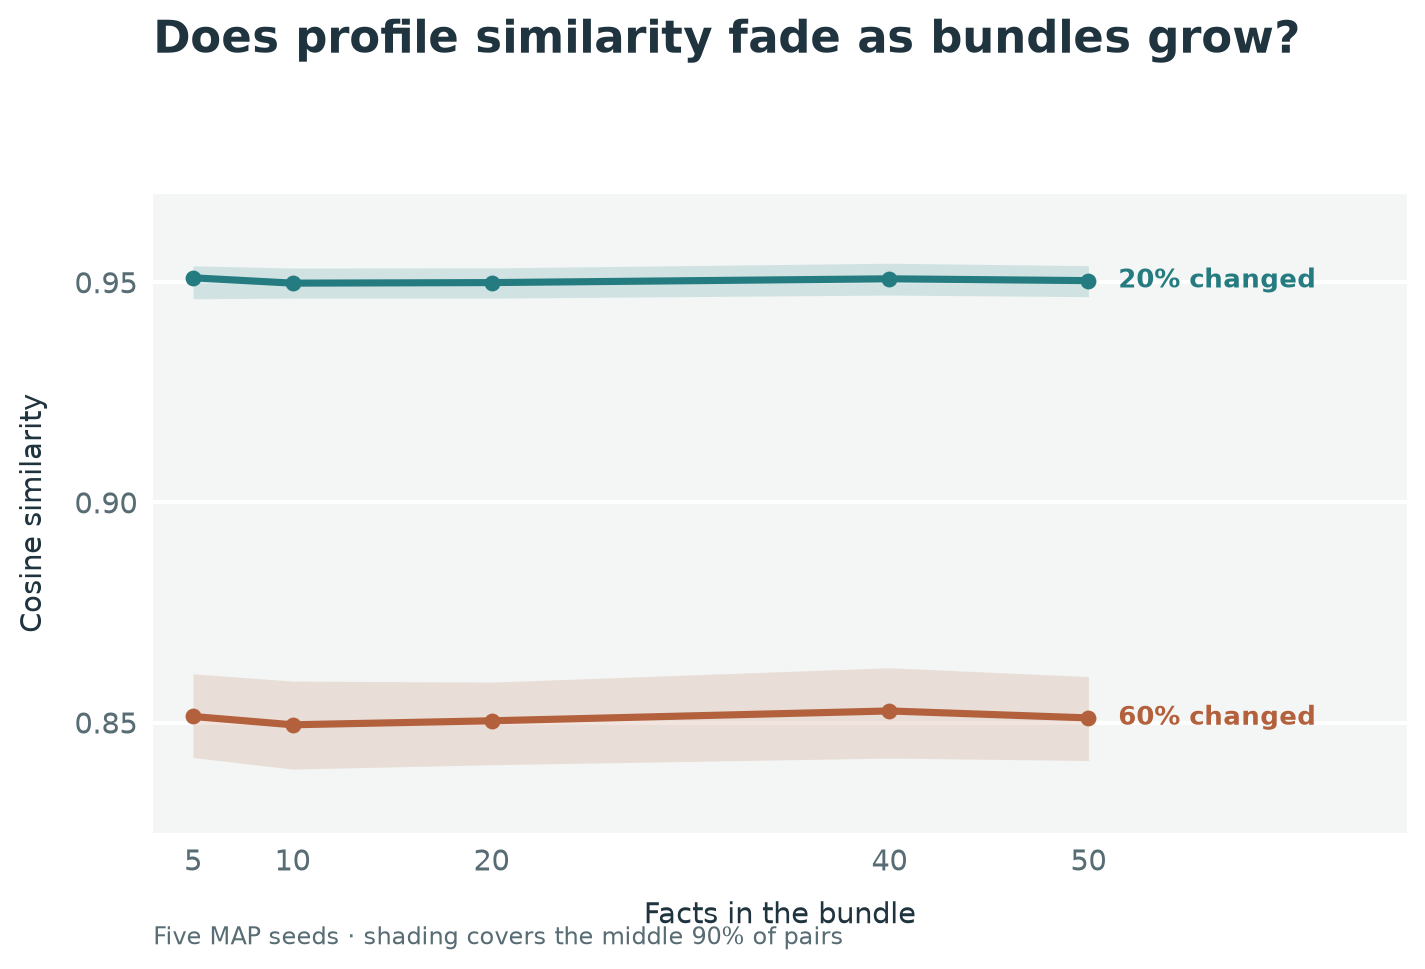
Similarity stays near 0.95 cosine for the 20% changes and 0.85 for the 60% changes, closely following the predictions before bundling. Adding answers doesn’t make the copies progressively less similar to their originals, and fewer changes consistently keep a copy closer.
Here, we’re adding controlled noise to the answers before encoding. Our post on holographic hypervectors explains how information is spread across the whole representation. E3 shows that, with nearby ratings encoded similarly, the overall response pattern can still provide a useful signal for retrieving related records.
This tests changed copies of synthetic profiles. Whether naturally close different respondents behave similarly still needs testing with a more varied dataset.
Conclusions
The three experiments in this post give us different answers for different operations on bundled hypervectors. We can summarize the findings as follows:
- Exact recovery depends on dimension as records grow. 512 dimensions are often too low for a meaningful bundled hypervector representation, because adding facts makes exact answers harder to recover. Increasing the dimensions to several thousand reduces errors during recovery and improves recall, so we should choose dimension accordingly for the domain.
- Record comparison can remain useful despite recovery errors. Comparing complete bundles still finds similar profiles when some individual answers are recovered incorrectly. With more dimensions, those comparisons retain more of the expected closest matches. We should therefore evaluate which records are returned as well as the overall similarity ranking.
- Adding facts needn’t weaken profile similarity. At 4,096 dimensions, similarity to changed copies stays stable through 50 answers when the proportion of changed answers is fixed. The representation continues to distinguish slightly changed responses from substantially changed ones as more facts enter the bundle.
The useful lesson is that bundling capacity depends on the operation and precision we need for the application. We learned that when modelling the domain in a hyperspace of 4K-8K dimensions, a bundled representation can preserve useful similarities between records even as exact recovery of individual values becomes less reliable.
So far, we’ve tested whether records with similar values remain close in hypervector space as more facts are bundled. The next question is whether a search still returns the records we’re looking for in a much larger collection. Missing properties give us less information to match on, and an approximate index may skip a relevant record. The next post tests these external pressures.
The experiment repository contains the code, saved measurements, and reproducibility notes for the questionnaire study.
Footnotes
-
Doornenbal’s 2021 study examined responses from 4,678 Dutch adults using the 50-item IPIP questionnaire. More frequent worry and low mood were associated with poorer self-rated general health, after accounting for age and gender. ↩
-
A level hypervector represents one step on an ordered numerical scale. TorchHD’s
torchhd.levelcreates these hypervectors by gradually changing components between two random endpoints, so neighbouring levels share more components. We use five levels for ratings 1 to 5. ↩