
Turning feedback into learning
When tasters score a food product, their feedback reveals more than an overall rating. Explore how HDC turns those scores into patterns we can compare, revise and learn from.


On this page
When people rate something with many qualities, like a meal, a hotel stay or a training course, we usually boil their verdict down to a single number. A number is easy to sort and compare, but it doesn’t say which qualities earned the praise and which ones let it down.
Let’s understand this with an example of a food product development company that’s reworking one of its products. Before a new food product reaches store shelves, it goes through many rounds of tasting, where a group of tasters scores each recipe overall and on individual qualities such as texture, flavour and sweetness. Two recipes can earn the same overall score for entirely different reasons, and those reasons may not be immediately apparent from simply inspecting the raw scores.
Imagine you’re a food scientist who’s reworking a snack bar, and in the latest round of tasting, your new oat crunch bar scores 7/10. The tasters loved its crunch but found the flavour flat. Simultaneously, you may remember a cocoa date bar from your past records that also scored 7/10, but for the opposite reasons: a rich flavour let down by a texture the tasters called soft and chewy.
Hyperdimensional Computing (HDC) provides a way to combine those scores into representations that we can compare and update. Building on our earlier bundling capacity experiments, we’ll start with a practical question: which earlier recipes did people like for the same reasons? We’ll then see how the same representations can describe a target for the next trial and accumulate new feedback into learned representations called prototypes.
What rating scores miss
Your existing records already hold much of the story. Alongside an overall score, each tasting has a group summary of how much the tasters liked each quality, from 1 (disliked) to 5 (liked). A high sweetness score means they liked the sweetness, rather than that the bar was very sweet. Here’s how the oat crunch bar, the cocoa date bar and a peanut crisp bar from a trial two years ago compare:
| Recipe | Overall (out of 10) | Crunch | Flavour | Sweetness | Chewiness | Aftertaste |
|---|---|---|---|---|---|---|
| Oat crunch (new) | 7 | 5 | 2 | 3 | 4 | 3 |
| Cocoa date | 7 | 2 | 5 | 4 | 2 | 4 |
| Peanut crisp | 6 | 4 | 2 | 3 | 3 | 3 |
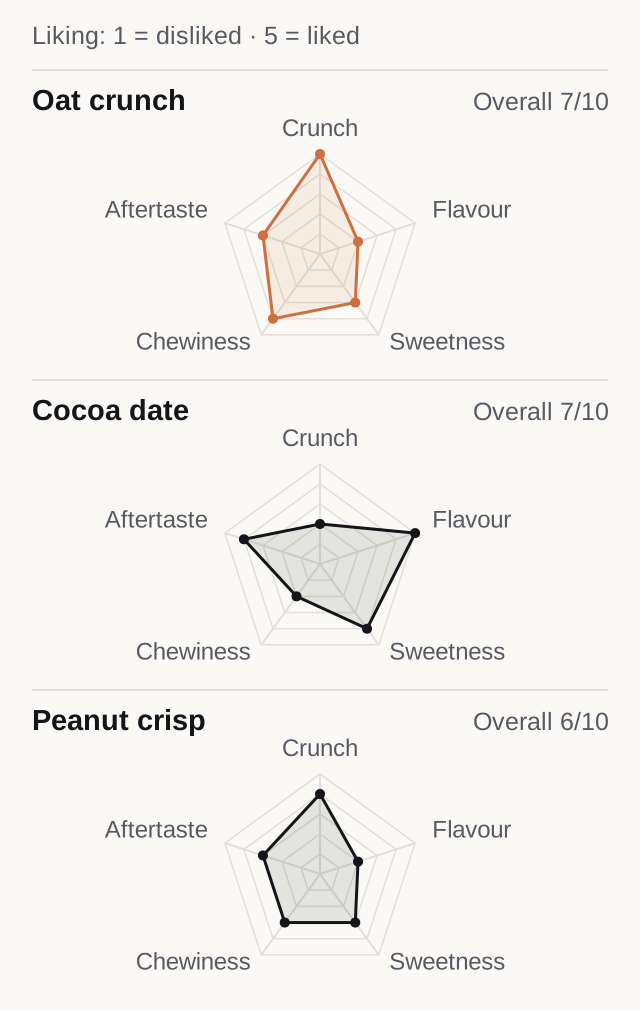
The oat crunch and cocoa date bars share an overall score of 7 but differ on the qualities behind it: one wins on crunch, the other wins on flavour. The peanut crisp bar scored 6 points, yet the tasters reacted to it in nearly the same way as the new oat crunch recipe, with strong crunch and weak flavour. If we want to learn from the past, the peanut crisp bar contains a relevant precedent pattern.
Across years of tastings when you have hundreds of recipes, sorting by overall rating isn’t granular enough: you may see the cocoa date bar result next to oat crunch, while missing the more relevant peanut crisp. Simple filtering for a crunch score of 5 that we liked in the oat crunch bar excludes peanut crisp entirely, because it missed that value by 1. Exact queries have their limits.
What we need is a way to compare all those qualities together, allowing nearby scores to count as partial matches. We can do this using HDC to encode each quality and its score into a combined pattern we can compare via similarity search.
Compare the whole pattern
A hypervector is a long list of numbers, often thousands of entries long. With HDC, we can represent each quality and score as a hypervector, then combine them into one for the whole recipe. Two operations make this possible: binding and bundling.
We start by giving each quality, such as crunch or flavour, its own randomly generated hypervector. The scores from 1 to 5 also get hypervectors, but we build these as a related set: neighbouring scores have similar patterns. Every recipe uses the same quality and score hypervectors, so we’re comparing them on the same terms.1
First, we combine a quality with its score through an operation called binding. Binding the crunch hypervector with the score for 4 creates a pattern representing “crunch scored 4”.
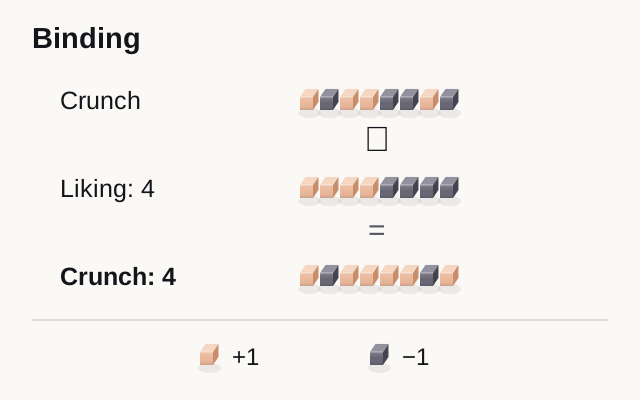
The bound pattern differs from “flavour scored 4”, because the quality is part of the association. Yet it still resembles “crunch scored 5”, because binding both scores with the same quality preserves their resemblance. The peanut crisp bar can therefore partly agree with yours on crunch, even though their scores differ by one point.
Next comes bundling: we add the five bound patterns, element-wise, to make one hypervector for the recipe. Each entry holds a sum of contributions from all five qualities. The patterns for crunch, flavour and the other qualities overlap across the whole hypervector instead of occupying separate slots.
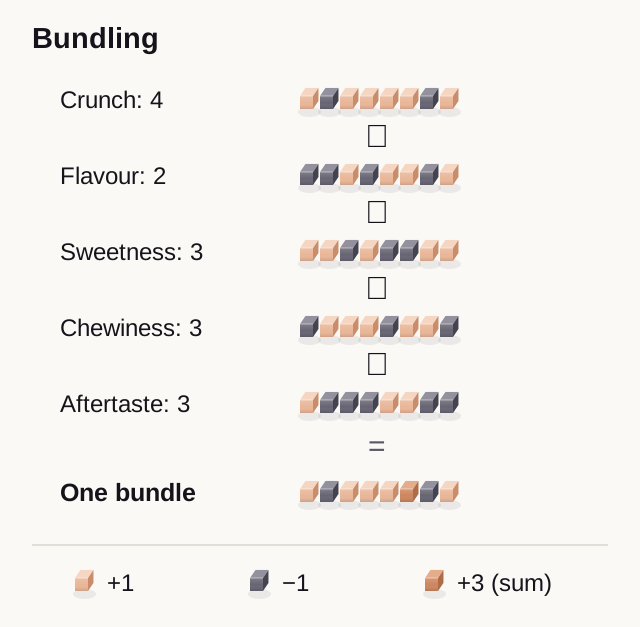
The result has the same number of entries whether we bundle five scores or fifty. Fixed length doesn’t necessarily mean less storage than the original scores. What it gives us here is a combined pattern we can compare directly with other recipes.
When two recipes agree on a quality, their bound patterns for that quality resemble each other and contribute to the similarity between the bundles. Contributions from different qualities also mix together, introducing interference. With enough dimensions, the matching contributions can still provide a useful signal through that interference.2 We can find a recipe with a similar pattern without first reading every individual score back out of its bundle.
To search, you compare your recipe’s hypervector with every other one in your history and rank them by cosine similarity, a standard measure of how closely two hypervectors point in the same direction.4
| Match for oat crunch | Earlier recipe | Overall rating | Pattern of liking scores |
|---|---|---|---|
| 1 | Peanut crisp | 6/10 | Closer |
| 2 | Cocoa date | 7/10 | Less similar |
In this example, the peanut crisp bar is the closer precedent to investigate, even though the cocoa date bar matches your overall rating.
For five qualities scored the same way every time, a spreadsheet formula comparing the columns could produce a similar ranking. Bundling also gives us a way to explore records with different sets of qualities.
A recipe whose tasters never scored aftertaste can leave that combination out of its hypervector. We can still compare it with the others, but we’re matching on less information, which can change the ranking. Recipe details such as key ingredients could, in principle, be added to the same hypervector, although we haven’t tested this.
In our bundling capacity experiments, comparing hypervectors built this way found largely the same closest matches as comparing the scores directly.5 Those tests used synthetic data rather than real tasting results, so how real tasting data behaves is still an open question.
What the bundle’s similarity tells us
Combining the scores doesn’t have to erase the relationships between them. When we compare two recipe bundles, agreement on crunch contributes to their similarity, as does agreement on flavour, sweetness and the other qualities. Nearby scores contribute partial agreement because of the level encoding. For complete records with the same equally weighted qualities, bundle similarity approximates the average similarity between their corresponding score hypervectors.
How does this work when all the facts overlap? Comparing the bundles also produces cross-quality contributions, such as crunch from one recipe interacting with flavour from another. The independently generated quality hypervectors make these contributions tend to cancel rather than consistently reinforce each other. Some interference remains, but with enough dimensions, agreement on corresponding qualities can still stand out.
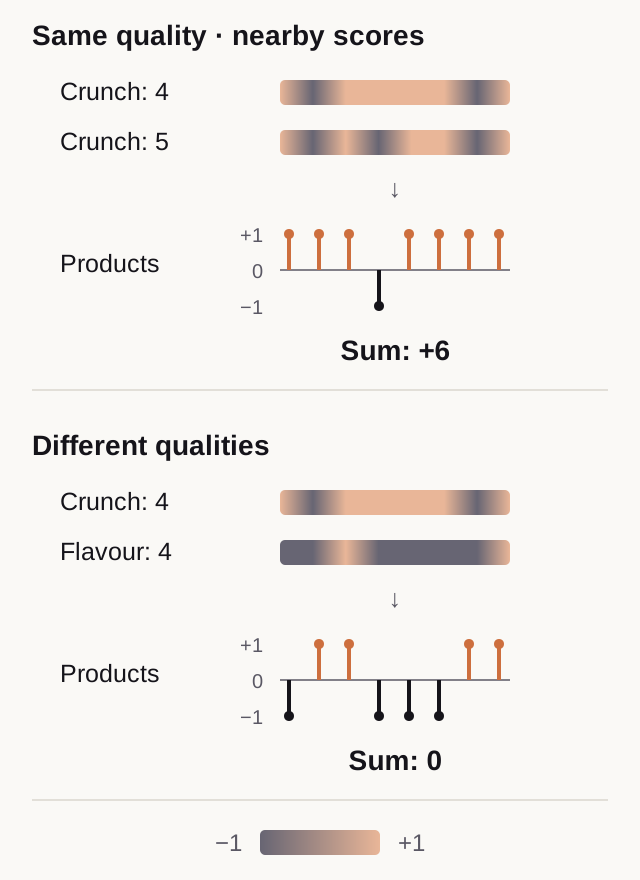
The useful consequence is that we can compare whole records without first recovering every score from their bundles. Reading a particular score and recognizing a similar overall pattern demand different kinds of precision. Our experiments showed that a bundle could remain useful for finding similar profiles even when some individual answers were recovered incorrectly.
The match reflects what we chose to encode. Here, it means similar likes and dislikes across the recorded qualities. It can’t tell us whether two tasters meant the same thing by “crunch”, or explain why they liked it. Those details would need their own representation or a return to the tasting notes.
Search for a better flavour without losing the crunch
Finding peanut crisp gives the team a starting point. The next question is more specific: which past trials earned better flavour scores while keeping a similar response to the other qualities? Searching again with the unchanged oat crunch bundle would still favour recipes with disappointing flavour. We need a query that describes the response we’re looking for.
For example, the team could keep four of oat crunch’s scores and change the target flavour score from 2 to 4:
| Quality | Current feedback | Target feedback |
|---|---|---|
| Crunch | 5 | 5 |
| Flavour | 2 | 4 |
| Sweetness | 3 | 3 |
| Chewiness | 4 | 4 |
| Aftertaste | 3 | 3 |
With the raw-sum bundles used here, we can construct that query by subtracting the exact bound contribution for “flavour scored 2” and adding the contribution for “flavour scored 4”. The other four contributions stay intact. This uses the same fact-removal principle we tested earlier. It requires the original score and the same encoding, rather than an approximate value recovered from the bundle. We change a copy for the query and retain the original tasting record.
Comparing this target bundle with past trials would produce candidates for the desired mix of responses. Similarity gives a soft ranking, so a requirement such as “crunch must score at least 4” should still be checked against the original score columns. From the candidates, the team could follow the recorded recipe versions and compare what changed between trials: ingredients, proportions or processing conditions. A promising result suggests a change worth testing, not a prediction that it will work in the oat bar.
The contribution of HDC here is a representation we can compose and revise through known facts. Vector search can rank these hypervectors, just as it ranks other vectors. Direct numeric vectors could also express this five-score target. HDC makes the role-value associations and their combination explicit, allowing the same operations to build a complete recipe representation, a partial query or a revised target. The food-development workflow is a proposed application of those operations, not an outcome measured by our questionnaire experiments.
Learn what successful trials have in common
So far, the team has searched for individual recipes: each stored hypervector represents one tasting record. But after several rounds of development, the team has another question: what feedback pattern tells us a snack bar meets the brief? For this product, success might mean that tasters enjoy both the crunch and the flavour, with no unpleasant aftertaste.
The team already has examples to learn from. It can label earlier trials “meets the brief” or “needs revision”, using its product requirements and the tasting results. These labels define two classes. Bundling the existing trial hypervectors within each class creates a class prototype, which is a combined representation of the feedback patterns associated with that class label.
A prototype gives the team something to compare a new trial against. Instead of finding one earlier snack bar, the team compares the new trial’s hypervector with the two class prototypes to suggest which group its feedback resembles. What is being learned is the association between a pattern of tasting scores and the team’s judgement that a recipe meets the brief.
Decide when new feedback should change the prototype
Suppose the next oat crunch trial earns better flavour scores while keeping its popular crunch. Its feedback may now resemble the meets the brief prototype. We can measure that resemblance using cosine distance: a smaller distance means a closer match, and we can set thresholds for how the system responds.
One possible policy uses two thresholds around each prototype. A very close example already fits the familiar pattern, so the system assigns it to that class without updating the prototype. An example a little farther away, but still within the outer threshold, is a candidate for the same class and can contribute something new. Beyond the outer threshold, the system excludes the example from that class and asks the team to assess it, and it may fit another class instead.
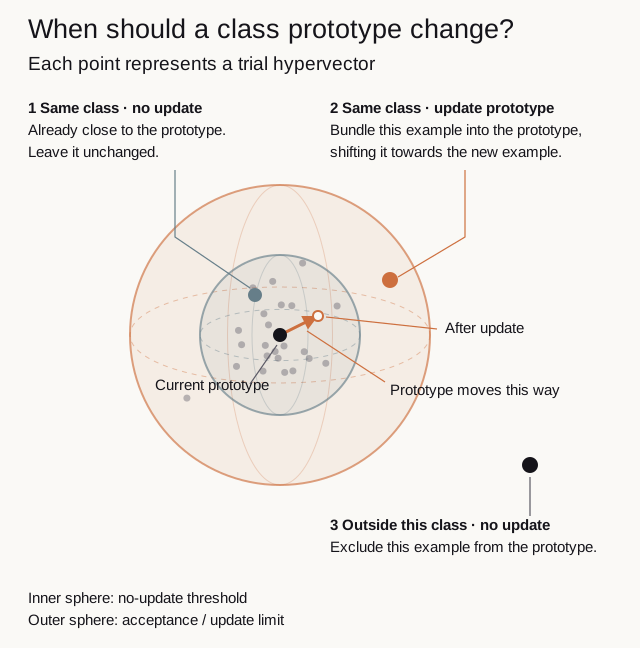
For the snack-bar team, the middle region could include a successful trial with a slightly different crunch-to-flavour balance. Once its class is confirmed, adding it helps the prototype reflect that additional way of meeting the brief. A trial with poor flavour and an unpleasant aftertaste should not pull the successful class towards failure simply because it is the closest available match.
The thresholds express how much variation the team will accept and need checking against labelled trials. If both classes accept a new example, or neither does, the team can review it before updating either prototype. Automatic updates based on predicted labels are possible, but a mistaken assignment can reinforce itself; confirmed labels provide a firmer starting point.
Learning through one addition
Updating the prototype uses the same bundling operation that combined the tasting facts. This time, we add a complete trial hypervector to the accumulated hypervectors of its class:
We keep the raw sum as the prototype and compare its direction with new examples. Adding an accepted example shifts that direction towards the example, so future trials with a similar score balance can match better. As more examples accumulate, each addition has less influence.
The update is just element-wise addition: one addition at each hypervector position. A 4,096-dimensional prototype therefore needs 4,096 additions to incorporate an already encoded trial, without replaying all previous tastings. The arithmetic is small enough for interactive updates; we have not measured an end-to-end latency for this proposed workflow.
The team is gradually learning which combinations of tasting responses count as success for this product. It is not yet predicting flavour from ingredients: the new trial still needs tasting scores before it can be encoded and assessed. The key change is that each confirmed example refines the shared pattern against which the next trial is judged.
From similar feedback to adaptable representations
An overall rating can hide the distinctions that make two experiences meaningfully similar. We saw this with snack bars, but the same question arises with hotels rated on location and service, or courses judged on explanations and practical exercises. When we record those qualities, we can look for agreement across them rather than treating equal overall scores as equivalent feedback.
HDC gives us a representation we can compose, compare and revise. Binding preserves the association between a quality and its score, while bundling combines those facts into one hypervector. The relationships remain useful for similarity search, and replacing a known contribution lets us construct a new target without rebuilding the rest of the record.
The same operations also support learning. Labelled trials can contribute to prototypes that evolve as new evidence arrives, with each additive update taking one pass over the hypervector. Learning the encoder can further adapt how examples are represented, though it requires additional training. Simple operations make incremental updates cheap to compute, but in practice, the system still needs to make reliable decisions for the task from fewer examples.
From a software developer’s perspective, HDC offers the opportunity to carry useful structure from individual observations into comparisons, targets, and learned prototypes. The key test is whether that structure keeps capturing the differences that matter as products and preferences change. For anyone sitting on years of feedback, there’s food for thought here: could those records become a learning resource that adapts with each new result?
Footnotes
-
The random pattern acts as a consistent label for a quality. It doesn’t need to describe what crunch tastes like. Reusing that label lets us compare crunch with crunch across recipes. The score patterns are deliberately related, so a 4 resembles a 5 more than a 1. ↩
-
A dimension is one position in the hypervector’s list of numbers. A hypervector with 4,096 entries has 4,096 dimensions, whether it holds five facts or fifty. More dimensions give the overlapping patterns more room to remain distinguishable. The information still comes from the same recipe observations. ↩
-
Level encoding represents an ordered scale with related hypervectors. Moving from one score to the next changes only some components, so adjacent scores share more of their pattern than distant scores. A 4 therefore resembles a 5 more than a 1. ↩
-
Cosine similarity compares the direction of two hypervectors without treating a longer hypervector as a better match just because its entries are larger. Here, it gives us a way to rank recipes by their encoded patterns. It isn’t a percentage of tasters who agreed or a probability that the recipes will taste alike. ↩
-
The earlier experiment used 31 synthetic questionnaire profiles with up to 50 answers each. It asked two different questions: could we read an individual answer back out, and could we find profiles with similar answers? Even when some individual answers were recovered incorrectly, comparing the whole bundles still found many of the same closest profiles as comparing the original answer lists. For this article, the useful takeaway is that a bundle can help us find relevant history without reproducing every score exactly. Some closest matches changed, and the experiment didn’t test food preferences or establish an advantage over comparing the scores directly. ↩